Using Wireshark to Analyze Network Traffic
Wireshark is a network analyzer that is used to analyze incoming and outgoing packets between source and destination hosts. This helps with getting a better understanding of the types of network traffic that appear on a specific network. This makes it a useful tool for both networking and security as it can be used to troubleshoot networking issues as well as identify malicious traffic on a network. This post will discuss the basics of Wireshark while also covering details on some of its useful features for analyzing network traffic. Wireshark can be downloaded from here.
Starting a Capture
To start analyzing network traffic in Wireshark, you can either start a live capture by selecting a specific network interface to listen on or you can select a saved capture file by selecting File > Open.
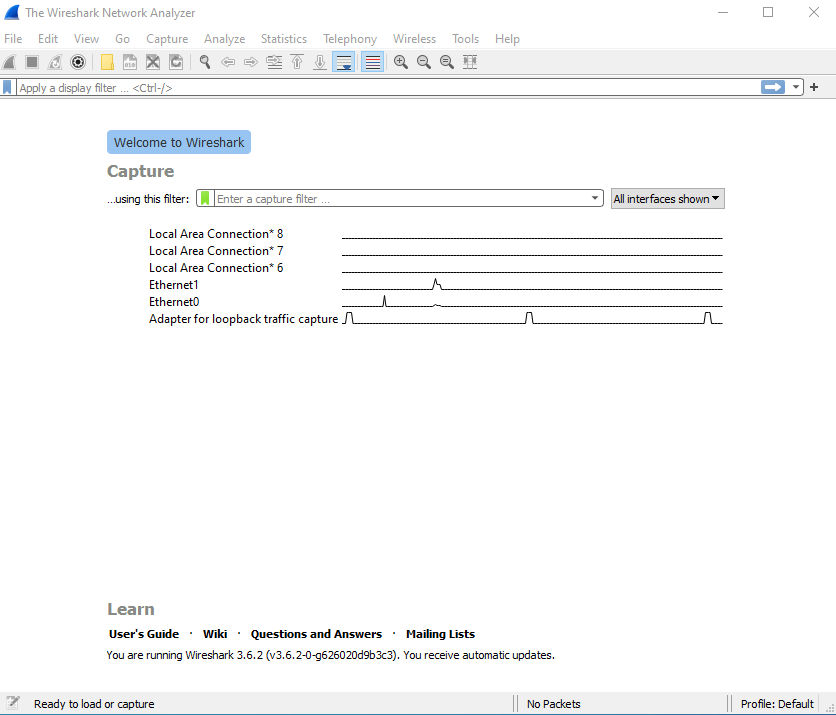
In my case, I will be working with a saved capture file. After starting a live capture or opening a capture file, you will arrive at the below screen:
User Interface
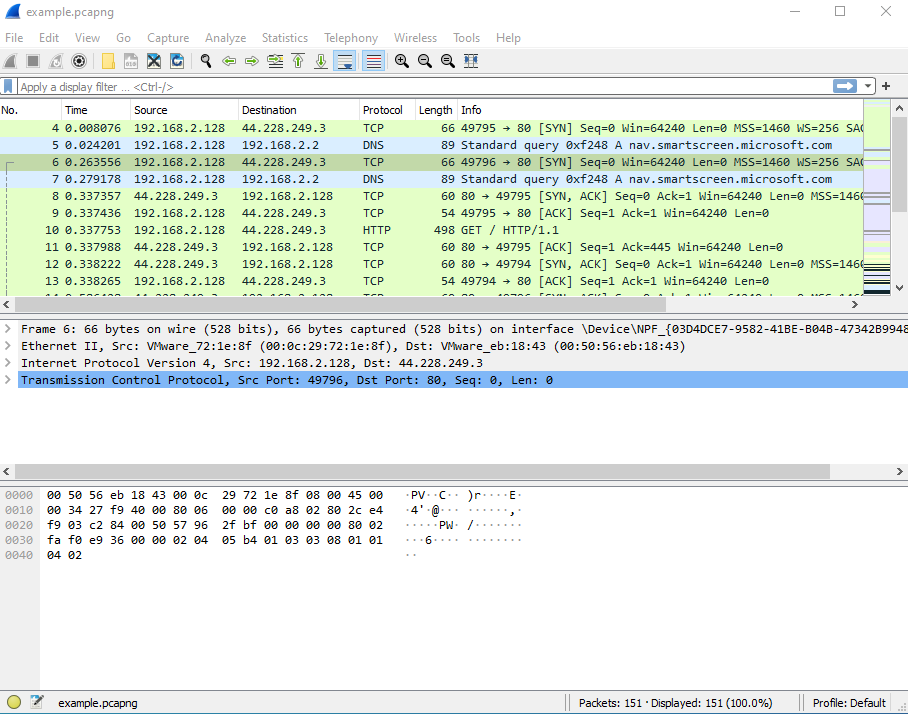
The main toolbar at the top displays various buttons such as starting and stopping a capture, selecting another network interface to listen on, etc. Going downwards, there is a field for filtering and displaying specific packets based on certain conditions. Next is the Packet List view which shows each packet that was sent and received during the capture. Below that is the Packet Details view which contains detailed information on each section of the packet. Each section contains additional information which can be viewed by expanding the section. Lastly, the bottom part of the screen displays the Packet Bytes view, which contains the data portion of the selected packet where the hex representation of the packet data is on the left while on the right this is displayed in ASCII format.
Customising the Display
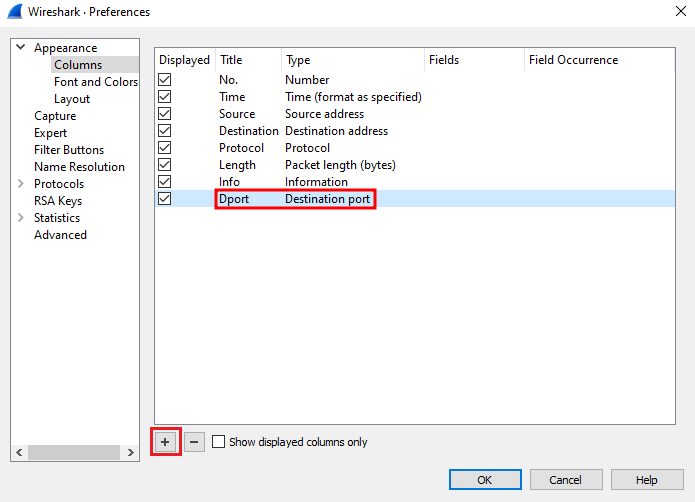
By default, Wireshark displays the time in seconds since the beginning of capture. To view the Time column in a human-readable format, select View > Time Display Format > Date and Time of Day. Each packet displayed has some properties such as the source and destination IP addresses and protocol. Only several properties are displayed but this can be modified to display additional properties such as the destination port number, which is useful for identifying the remote service that your host was connecting to. To add a column for the destination port, right-click any of the present columns then select "Column Preferences". In the new window that appears, select the '+' button at the bottom to add a new field and enter the 'Title' and 'Type' as below and click OK:
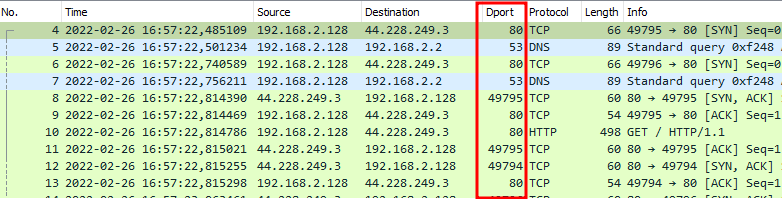
If the destination port column does not appear, you may need to scroll to the right and drag the column to the left, which I have done after the Destination column:
Displaying Protocol Streams
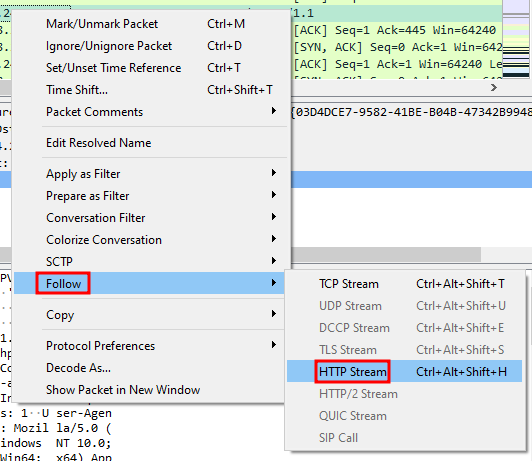
Wireshark can be used to display the sequence of packets that were sent and received between a specific source and destination host, which can give you a better understanding of the network communication that took place. To do this, right-click a specific packet that you want to view the communications for then select Follow > HTTP Stream. Since HTTP uses the TCP protocol, you could also follow the TCP stream, which can also be selected for other networking protocols that are based on TCP.
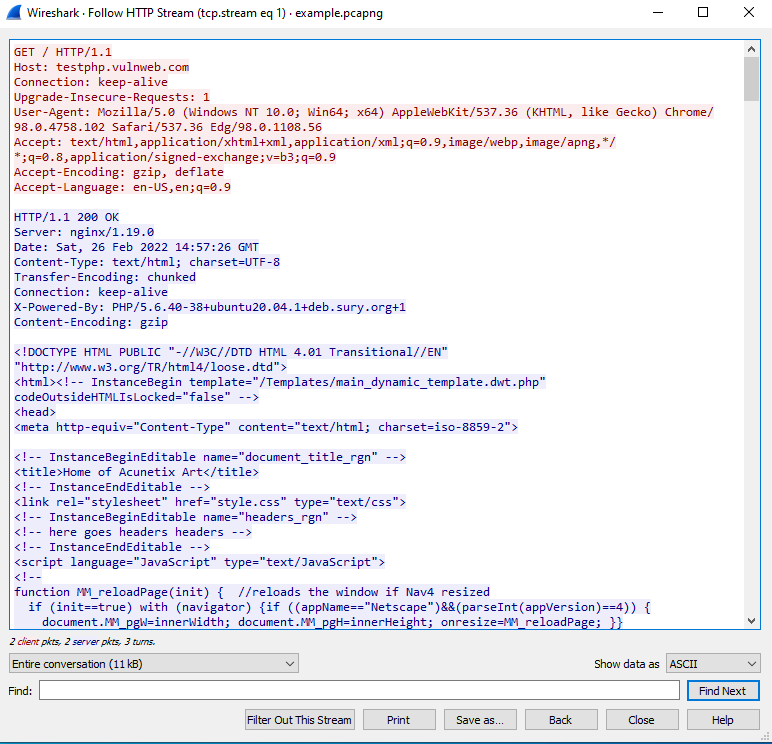
Here, we can see the communication that took place between the client (red) and server (blue). Based on this, we can tell that the client made a request to testphp.vulnweb.com over HTTP and that the response from the server contains HTML code, which is ultimately received and rendered by the web browser to view the web page. Wireshark also allows us to view some other data that is contained in the stream. Here we can see that Nginx, PHP, and Ubuntu are running on testphp.vulnweb.com as per the server's HTTP response headers.
Filtering Packets using the Display Filter
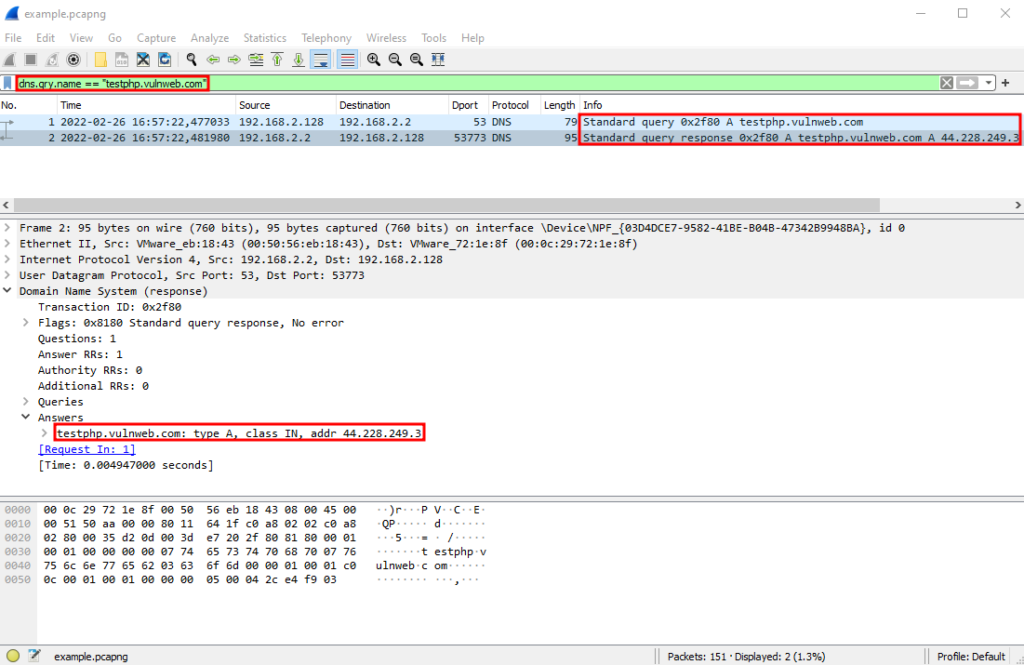
Another useful feature of Wireshark is that you can filter the display to only view packets with specific properties. Since accessing testphp.vulnweb.com requires DNS to take place before accessing the site, let's filter the output to only show DNS packets that were sent for testphp.vulnweb.com. To do this, enter dns.qry.name == "testphp.vulnweb.com" in the green input field and hit enter. Here we can see that there were two packets: one for the DNS query for "testphp.vulnweb.com" and a second one for the DNS query response, which contains the resolved IP address for "testphp.vulnweb.com" (44.228.249.3):
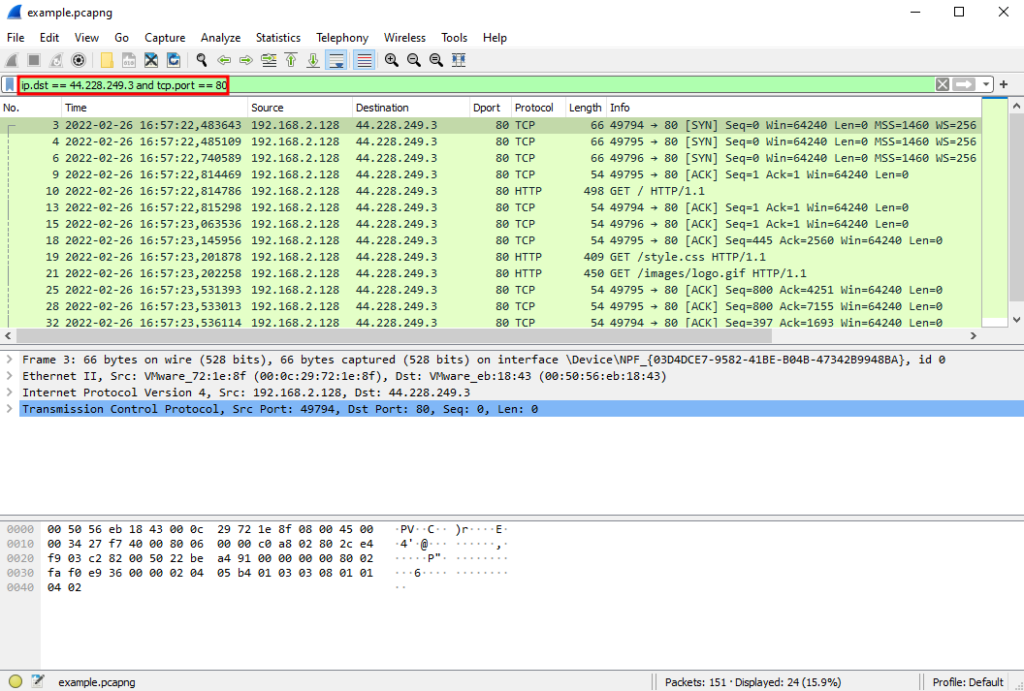
Multiple filter rules can also be combined using boolean logic. Using the IP address from above, we can enter a filter rule to only display those packets where the destination was '44.228.249.3' and the port was 80 by entering ip.dst == 44.228.249.3 and tcp.port == 80. Additional examples of display filters are available on the official Wireshark wiki.
Other Features
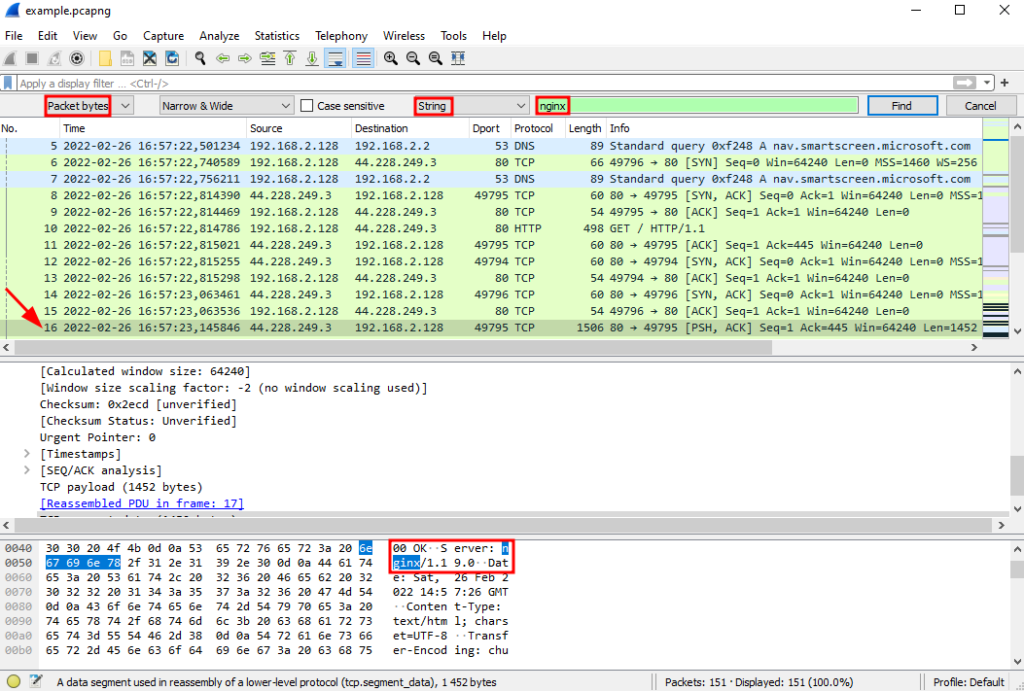
Wireshark contains many other features. For instance, you can search for a specific string that appears across all the packets. To do this, select Edit > Find Packet (a search bar will appear below the display filter). Next, select 'Packet bytes' from the first drop-down list and 'String' for the third one then enter the string to search for in the textbox and click 'Find'. Here I am searching for 'nginx' with the first match being found in the 16th packet and the nginx string being highlighted in the Packet Bytes view:
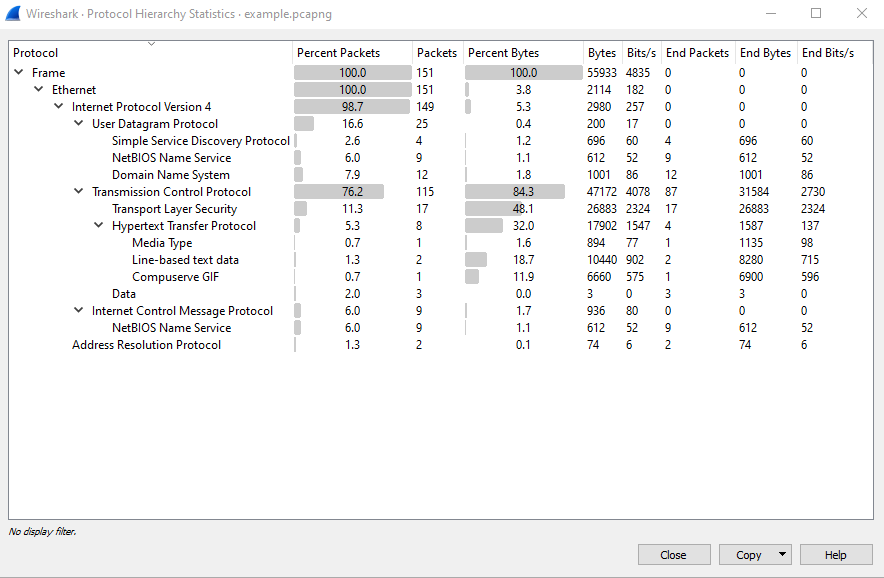
Other useful features include 'Protocol Hierarchy' and 'Endpoints' (available from the 'Statistics' menu at the top). The Protocol Hierarchy gives you an overview of all the network protocols that occurred during the network capture along with some stats per protocol:
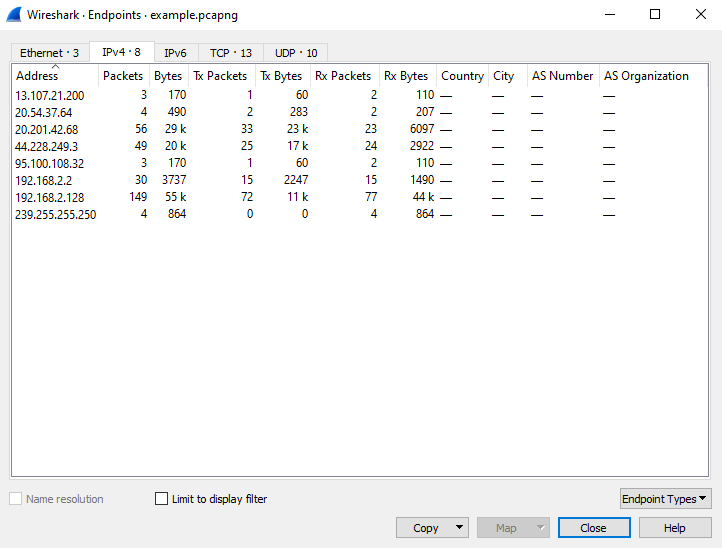
The Endpoints window shows all the hosts that appeared in the network capture and this can be viewed per protocol. For example, selecting the 'Ethernet' tab will display all the MAC addresses, IPv4 will display the IP addresses and TCP will display the socket connections (IP address and port pair).
These are just some of the features that are available in Wireshark and there many others that can be used to facilitate the analysis of network traffic.
tags: networking wireshark